
Bitcoin Update – 13 April
- bitcoinastro369
- 1 day ago
- 3 min read
We are now inside one of the most important time windows for April: April 13–14. These dates were calculated using multiple independent methods—astrology, geometry, and pure mathematics. Below I'll walk through a few geometry-based charts (Gann angles and trend lines) to clarify where price is heading.
Chart 1 – Cyclical Turning Points
This chart was posted several months ago. Every date marked has played out exactly as a turn. Each time the lines cross, we see a pivot. The dates on that chart are:
Jan 14 → Feb 6 → Feb 26 → Mar 17 → Apr 14 → May 6 → Jun 14 → Sep 25
So far, every single one has worked. Tomorrow, April 14, is next.

Chart 2 – Gann Angles as Support & Resistance
Every time price reaches one of these angles, it reverses—because these angles act as natural support and resistance. We are now approaching the next angle, which is likely to act as resistance.

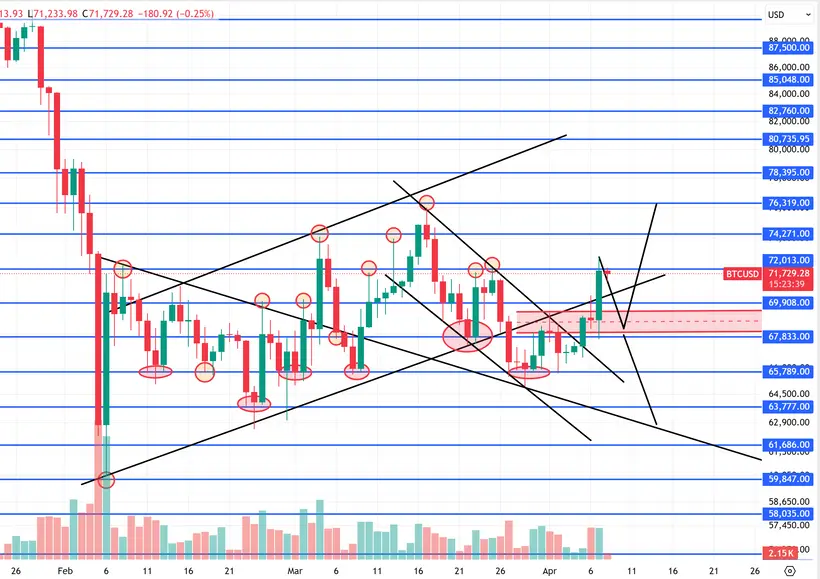
Chart 3 – Trend Lines
Multiple trend lines are currently acting as support and resistance. Price is now sitting at 74,300 – a resistance level – and is attempting to break above that line. At the same time, price looks to be heading toward the top of the broader channel.

Planetary Move & Timing
I mentioned multiple times that a planetary move started on April 6 and ends on April 14. Within these windows, price typically moves in the same direction for the entire period.
If we were going to reverse down, the midpoint (April 10) was the most logical point. Instead:
April 11 → high
April 12 → decline
April 13 → huge buy surge, price shot higher than previous days
Tomorrow (April 14) is the end of this move. At the start of the month, I leaned toward a low here. Instead, it's becoming clear that April 14 will mark a high – but still a turning point.
As I've said many times: sometimes you have to wait almost until the pivot itself to know whether it will be a high or a low.
Weekly Chart – W Pattern
At the beginning of April, I pointed out that Bitcoin is forming a bullish W pattern on the weekly chart. So far, that has proven correct.
Invalidation level for this pattern: a rejection and close below 69,000.
My Current POV
Trend remains bullish, even though price is at resistance.
If we break above 74,500, expect a sharp move toward 77,000–78,000.
Since the February lows, I've repeatedly stated that I expect this upside move to last 8–10 weeks.
April 24 still marks the end of that period – and I still expect a high there, unless we see a hard rejection in the next few days.
Important Reminder on Pivots
Pivots can be:
A low
A high
A pause (consolidation) before continuation in the same direction
Example: April 2025 – every pivot I had, price stopped, consolidated for a few days, then continued up. No reversals.
Summary:
April 14 = likely high / turning point
Break above 74,500 → 77–78k
W pattern bullish unless 69k breaks
April 24 remains the larger target for a top
Trade the levels, respect the timing.
We are at a critical point in both time and price.
Next 24 hours will be decisive.
More updates soon.
Bitcoin Astro


Comments