
July 2025 Premium Forecast – Harmonic Trading Matrix
- bitcoinastro369
- Jun 23
- 6 min read
Navigating the Energies Shaping Bitcoin This Month Welcome to the July forecast. We’re entering a highly charged and transitional month, wit
Navigating the Energies Shaping Bitcoin This Month
Welcome to the July forecast.
We’re entering a highly charged and transitional month, with several planetary alignments activating key points in Bitcoin’s natal chart—as well as significant collective shifts in the sky, most notably Uranus entering Gemini. This is a month of rapid reversals, unexpected moves, and long-term shifts beginning to take root.
Below is your breakdown of the month’s positive and challenging transits, with clear interpretations for timing and possible market effects.
🟢 POSITIVE INFLUENCES & SUPPORTIVE ENERGY
July 3-4 – Venus trine BTC Jupiter
A classic sign of optimism and bullish momentum. Jupiter rules expansion and growth, and Venus rules money and value—this trine can bring a temporary bullish boost or renewed buying interest around this date.
July 3-4 – Venus square BTC Venus
This could mean a pause or short-term tension before the trine to Jupiter kicks in. Often shows up as a dip before a rebound.
July 7 – Venus trine BTC Mercury
Supports positive news, announcements, or buying sentiment. Mercury is linked to communication and trading. Look for possible upward movement or stabilizing price action around this time.
July 8 – Venus sextile BTC Moon
Adds emotional harmony to the market. The Moon in a natal chart often reflects collective sentiment—this could align with a recovery bounce or confidence returning.
July 10 – Mars trine BTC Sun
High-energy bullish aspect. Mars brings momentum, and trine to BTC's Sun could reflect a surge in strength or a breakout attempt. Mark this date closely.
July 11 – Sun trine BTC Uranus
Innovation and sudden changes—but in a trine, this is usually positive or stabilizing. Could bring unexpected bullish developments.
July 13 – Sun sextile BTC Saturn
Stabilizing, grounding. Saturn brings structure and discipline. This could support the formation of a strong base or confirm support holding.
🔴 CHALLENGING ASPECTS & POTENTIAL VOLATILITY
July 5 – Sun opposite BTC Sun
The halfway point in the solar cycle—often marks a shift or reversal in energy. Be cautious around this date for possible mid-cycle turning point.
July 5 – Jupiter opposite BTC Mars
Jupiter amplifies whatever it touches. Opposing BTC's aggressive Mars could indicate exaggerated volatility, overreactions, or impulsive price moves. Watch for a spike followed by a sharp correction.
July 12–14 – Uranus square BTC Venus
Uranus is unpredictable and Venus rules value. This square is a classic signature for price instability, shocks, or sudden changes in trend—potentially down or up, but often sharp and unexpected. Critical window.
July 14–17 – Pluto conjunct BTC Mercury
Pluto brings deep transformation, control, or power struggles. When conjunct Mercury (markets, messages, decisions), this can reflect manipulation, intense pressure, or a breakdown and rebuild of market logic. This is a highly sensitive period, and smart money may move silently during this time.
July 20 – Mars Opposing Bitcoin’s Uranus
Mars (aggression, action) opposing Uranus (sudden disruption, instability) is a very volatile and dangerous aspect. This is not a breakout-friendly Mars aspect—it tends to be chaotic and destructive, often triggering panic selling or forced liquidations.
July 21 – Venus Square Bitcoin’s Uranus
Venus (value, financial flow) squaring Uranus causes disruption to perceived value and confidence
Sun Opposing Bitcoin’s Jupiter
The Sun’s opposition to Bitcoin’s natal Jupiter brings imbalance to expansion energy.
July 24 – Mars Conjunct Bitcoin’s Saturn
Mars (force) meeting Saturn (restriction) is an intense, suppressive alignment.
🌐 GENERAL ASTROLOGY TRANSITS (Market-Wide Influence)
July 1 – Mercury 30° Jupiter
Minor influence but can spark optimistic chatter or misleading optimism—not all info is complete here.
July 4 – Venus conjunct Uranus
Unexpected financial news or market moves—often bullish short-term but unstable.
July 6-7 – Venus sextile Saturn/Neptune & trine Pluto
Supportive if the market is already recovering. Could bring balance after volatility. Watch this trio for attempts to stabilize or rescue price action.
July 7 – Uranus enters Gemini
MAJOR cycle shift. Uranus only changes signs every ~7 years. Moving into Gemini will start reshaping how tech, communication, and even trading platforms evolve. In the short term, expect disruption and new trends emerging.
July 11 – Moon conjunct Pluto
Emotional intensity—watch for sentiment extremes.
July 14 – Moon square Uranus
Sudden mood changes in the market. Possible panic wicks or emotional trading spikes.
July 18 – Sun square Moon; Mercury sextile Venus
Internal tension in the market. Mixed signals. Mercury-Venus helps communications but expect hesitation or confusion on this day.
July 23 – Venus square Mars; Sun sextile Uranus
Venus-Mars tension brings friction between desire and action. Could reflect false breakouts or resistance zones. Uranus brings a surprising twist.
July 24 – Sun trine Saturn & Neptune
Good for structure and long-term vision—if price action survives earlier volatility, this could form a solid recovery base.
July 25 – Sun opposite Pluto
Final clash of power. Often shows control battles or price suppression before a shift. This marks the end of a high-pressure window.
July brings a powerful shift as three key planets go retrograde—slowing down the energy and turning focus inward:
🔹 Neptune Retrograde – July 4
Time to cut through illusions. What felt unclear or idealistic may now be revealed in truth. Markets may respond with increased skepticism or disillusionment.
🔹 Saturn Retrograde – July 13
Structure, discipline, and long-term planning come under review. Expect delays, reevaluations, or karmic tests. Weak foundations—especially in financial systems—may be exposed.
🔹 Mercury Retrograde – July 17
Communication, trading, and short-term decisions become tricky. Double-check everything—false breakouts, misleading signals, and emotional trades are common in this phase.
🧭 FINAL THOUGHTS
This month has a very dual energy—supportive, stabilizing aspects especially early-to-mid month, but layered with extreme volatility, sudden reversals, and deep psychological shifts especially around the 12th–17th and again near the end of the month.
📅 Key Turning Point Dates for July 📅
These are not just ordinary dates—they are Square Out Dates, calculated using advanced timing techniques that blend planetary motion, price harmonics, and time geometry.
Each of these dates has been derived through multiple layers of calculation, including:
🔹 Time cycles
🔹 Planetary degrees and harmonics
🔹 Gann-based square outs
🔹 Specific planetary positions relative to Bitcoin’s natal chart
🚨 Important Dates to Watch in July:
🔸 July 2
🔸 July 7
🔸 July 11
🔸 July 17
🔸 July 22
These are not random. Each one aligns with a vibrational point of tension or release in the market structure. Expect potential reversals, accelerations, or pauses in trend near these dates.
These are the moments where time and price synchronize—the true edge is not in reacting to news, but in anticipating when energy is about to shift.
If you’ve been following my work, you already know how accurate these time pivots have been.
As always, don’t just look at direction—watch for the turn. These windows are where time and vibration align, and that’s where the edge is found.
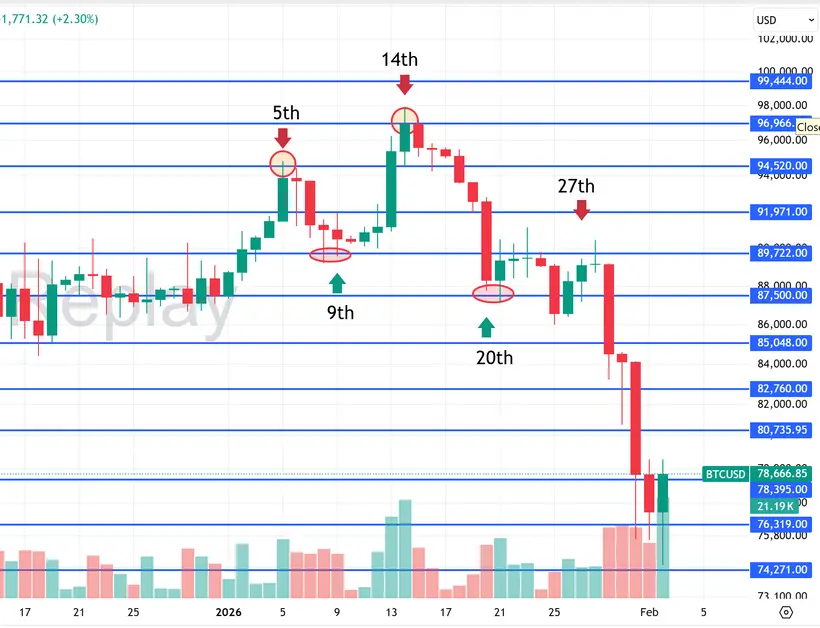
Other square out dates to keep in mind:8th,12th,15th,23rd,25th,28th
BTC Short-Term Outlook
1️⃣ Daily “W” Pattern Taking Shape
• A classic bullish formation that often launches the next leg up once neckline resistance gives way.
2️⃣ Gann Angle in the Crosshairs
• Right now price is pressing against a key upward Gann line. See chart below.
• A decisive close above that angle opens the path to the next harmonic targets at ≈ $110,500 and 112,000
3️⃣ Range Still Rules Until It Doesn’t
• Bitcoin has been boxed between $112 K (ceiling) and $99 K (floor) for weeks.
• Until we get a clear break—either above $112 K or below $99 K—we keep trading the range.
What to Watch
• Volume + daily close over the Gann angle = confirmation of bullish follow-through toward 110.5 K.
• Failure/rejection here could send the price back toward the mid-range or even a sweep of 99K liquidity.

In the chart, I’ve shared:
The blue Gann angles represent key dynamic support and resistance levels based on both price and time progression. These angles are not just trendlines—they’re calculated using Gann’s geometry, showing where price should find support or resistance if it’s following harmonic structure.
The black horizontal lines mark major static support and resistance zones—price levels where Bitcoin has historically reacted, paused, or reversed.
Together, these levels form a matrix of time and price interaction.
When the price touches a Gann angle and a horizontal level, it becomes a high-probability reaction zone—watch closely for either continuation or reversal.
These are the key zones to monitor as the next move unfolds.
More detailed price levels, chart setups, and pivot projections coming soon for Premium members.
Stay tuned & stay aligned,
— Harmonic Trading Matrix


Comments